8,768
Retrieved images
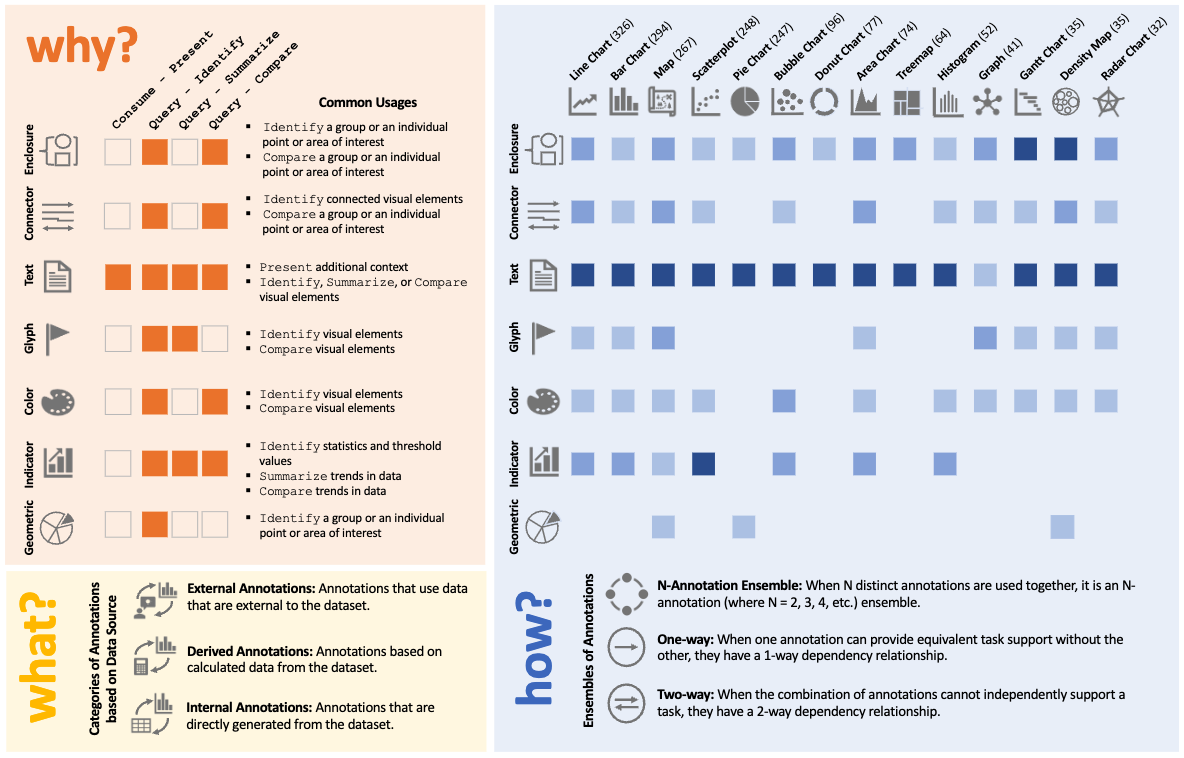
A qualitative study of 1,888 annotated charts across 14 chart types. The paper identifies seven annotation types and organizes annotation design around task, annotation form, and data source.
The paper frames annotation design with three questions. Why asks what task the annotation supports. How covers the annotation type or ensemble used to support that task. What identifies whether the annotation content comes from the chart data, from a calculation, or from outside knowledge.
The dataset came from Google Images and was narrowed through duplicate removal and chart screening. Two coders then iteratively labeled the remaining charts to identify recurring annotation types and usage patterns.
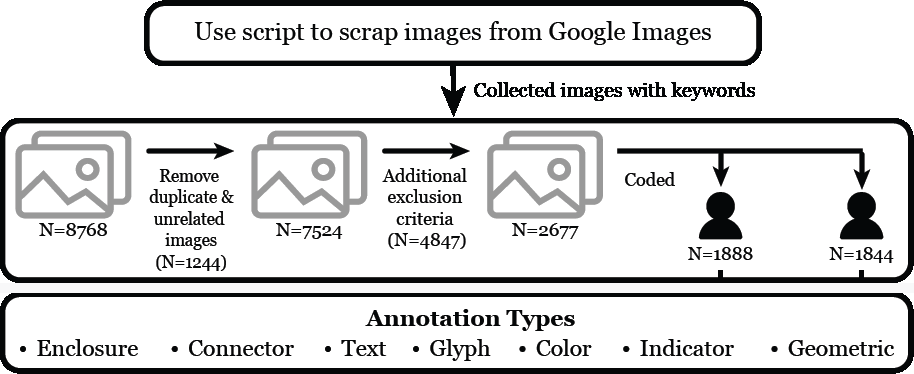
Retrieved 8,768 annotated chart images across 14 chart types.
Removed 1,244 duplicates and excluded 4,847 charts that were out of scope, unclear, unannotated, or not based on real data.
Two coders worked in multiple rounds, starting from five annotation types from prior work and refining them into seven recurring types.
Reliability: The first coder retained 1,888 charts for analysis. The average Cohen's kappa across coders was 0.886.
These seven cards summarize the annotation types reported in the paper. Open a card to see the tasks each type supports, common ensembles, likely data sources, and where it appears in the case studies.
The paper applies the design space to three published charts. Each case shows how annotation choices support a task, take a visual form, and draw from a data source.
@article{rahman2024annotation,
  title   = {A Qualitative Analysis of Common Practices in
             Annotations: A Taxonomy and Design Space},
  author  = {Rahman, Md Dilshadur and Quadri, Ghulam Jilani
             and Doppalapudi, Bhavana and Szafir, Danielle Albers
             and Rosen, Paul},
  journal = {IEEE Transactions on Visualization and Computer Graphics},
  year    = {2024},
  doi     = {10.1109/TVCG.2025.3565855}
}